Coming into DataFrames, one of my biggest pain points was finding out where the NAN (Not A Number) or NAT (Not A Time) is in my plethora of data. I prefer not to drop these rows or ignore them during crucial calculations.
Sometimes I may want to find out exactly where these values are so I can replace them with more sensible numbers such as averages in a Time Series related data.

Pandas is such a powerful library, you can create an index out of your DataFrame to figure out the NAN/NAT rows.
You can skip all the way to the bottom to see the code snippet or read along how these Pandas methods will work together.
Let’s say I have a DataFrame that I suspected having missing values.
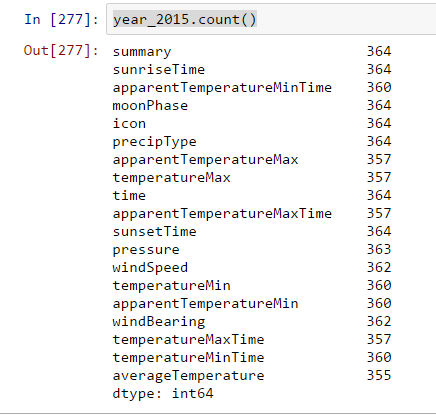
This is an actual data for my Weather Data Set and I was expecting to have a count of 365 for the year 2015. The .count() method is great for detecting because it doesn’t include NAN or NAT values as a frequency by default.
Now to the meat. The pd.isnull() checks one by one if any of your cells is null or not and returns a boolean DataFrame.
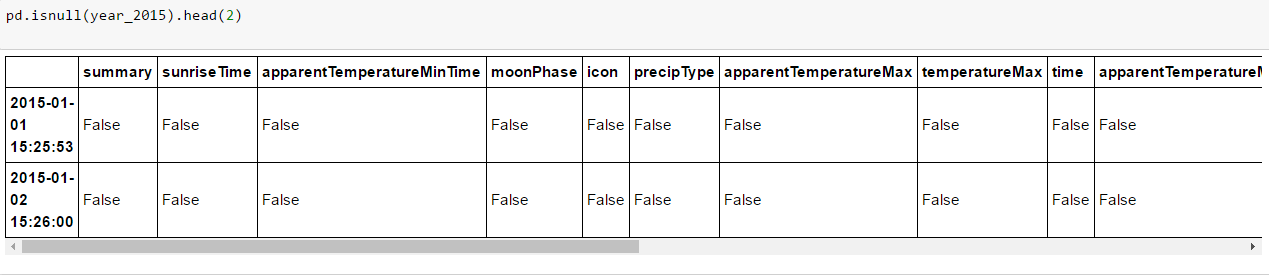
Not useful yet, because we don’t have the time to check through the True cases for every row.
Next is the pd.DataFrame.any() method. This method looks for the specified axis (column-wise or row-wise) if there is at least one True case.
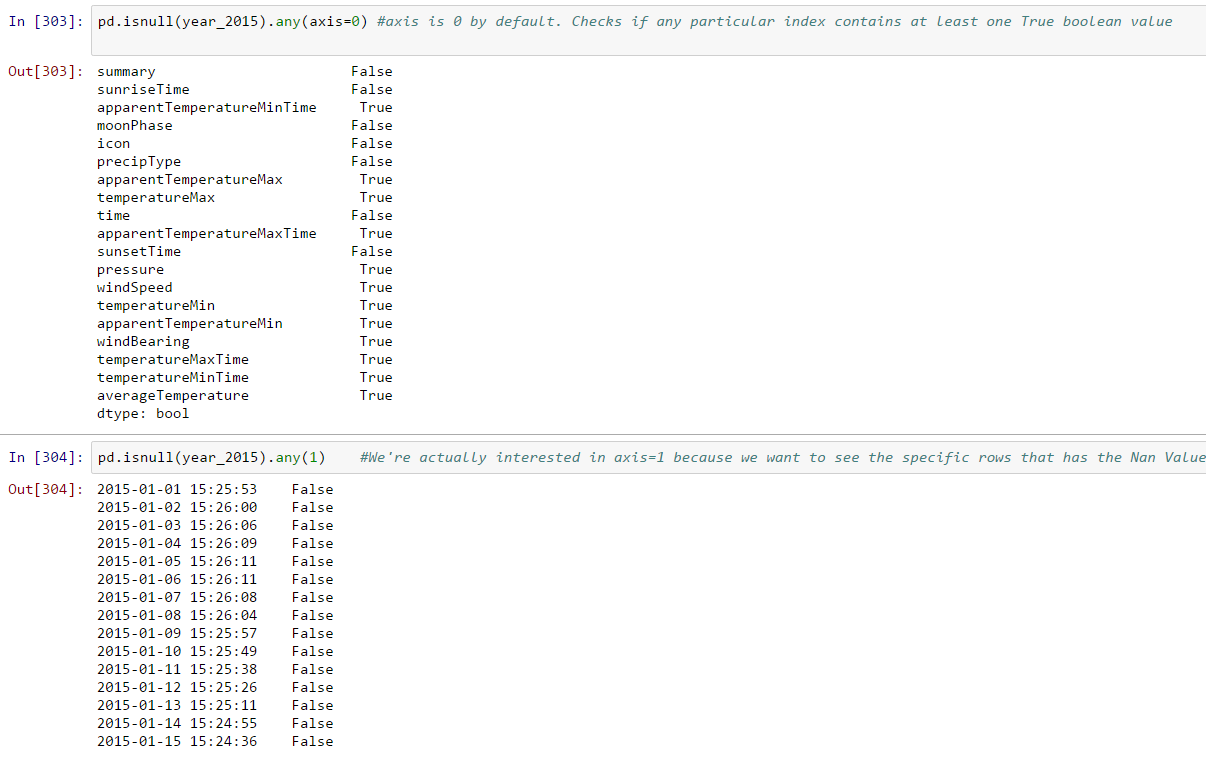
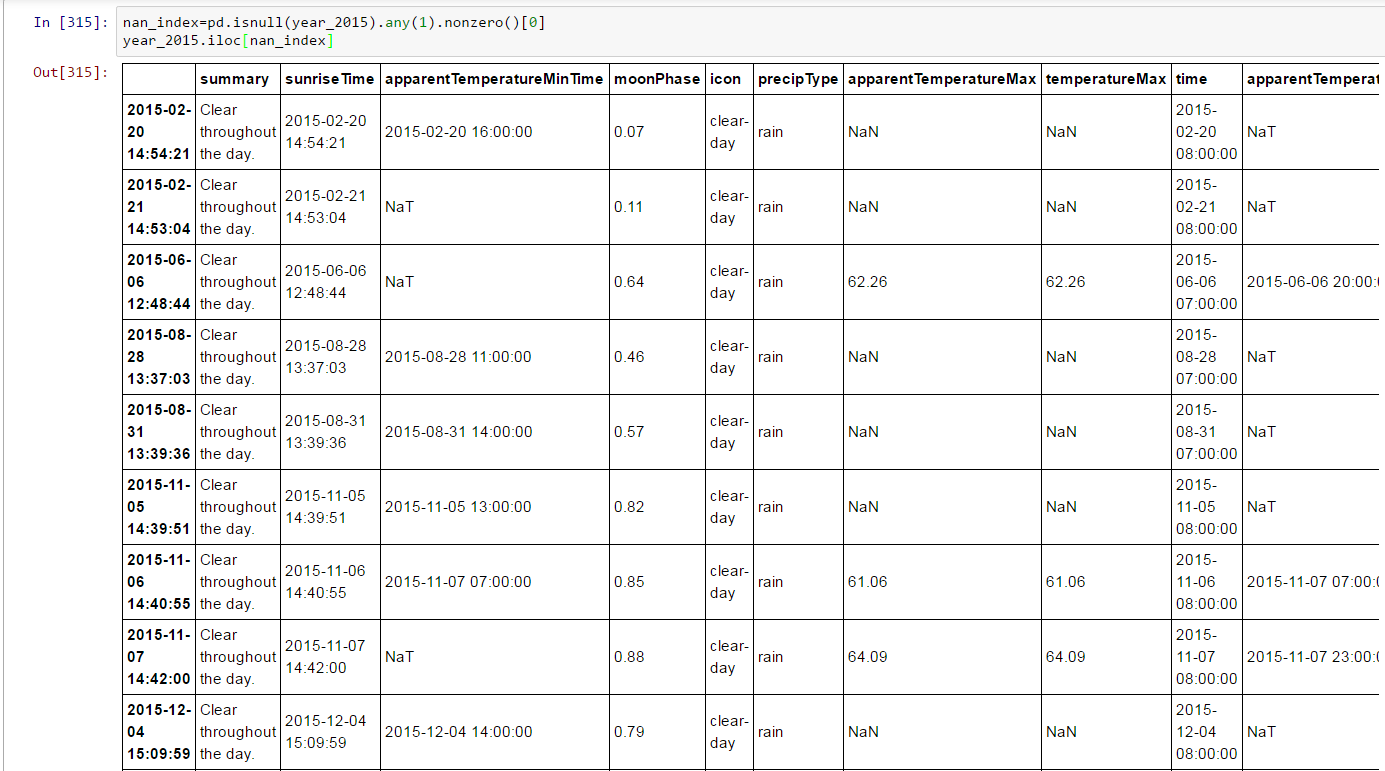
We’re almost there. The above method will tell me which rows has null at least one null value. Now I want to see ONLY indexes that has the null values.

To see if it’s working….
Now you know where the NAN/NAT values are in your DataFrame, what will you do?
If you’re too darn lazy, maybe you’ll just use the DataFrame.interpolate() which fills in the differences of previous row and the next row.
Code Snippet below, enjoy!:
df=pd.DataFrame({'col1':[1,2,np.NAN,3,4],'col2':['bam','boo','foo','john',pd.NaT]}) ##Create random data
nan_dex= pd.isnull(df).any(1).nonzero()    #Create index with nans
df.iloc[nan_dex]  #show me the nans

Leave a comment